The short version. Acetone raises the double-layer capacitance of Cu, and methylamine lowers it, even though both molecules are more polarizable than water. To see why, I modeled the water around them. With frozen water geometries, one explicit layer gives about 7.4 µF cm⁻² and a three-layer snapshot average gives about 4.2 µF cm⁻², against about 13.35 µF cm⁻² for continuum solvent alone. Placed in those layers, acetone pushes the response up and methylamine pushes it down, mostly through what they do to their water neighbors. All of this happens before the potential is anywhere near where the organic reduction runs.
Two solutes, opposite signs
The first puzzle was a sign. Add acetone to the electrolyte around Cu and the measured capacitance goes up. Add methylamine and it goes down. If either solute simply replaced some water with a more polarizable molecule, both should push the same way. The experiment was telling me early on that the neighbors mattered more than the molecule.
This is the quiet start of the series. Acetone and methylamine are the two reactants of a reductive amination: they condense to an imine, which is then reduced to an amine. Before asking how that reduction works, I wanted to know what each reactant does to the place where it will happen.
The impedance measurements used polished Cu in 0.01 M NaClO₄, brought to pH 12 with KOH, over a window from −0.227 to −0.527 V versus the reversible hydrogen electrode (RHE). The capacitance minimum sat near −0.32 V. That is a convenient place to start: close to zero charge, and before a large faradaic current takes over the signal.
Capacitance measures how much extra charge an interface takes on when the potential changes. At the molecular scale, that depends on much more than how soft one electron cloud is. Where molecules sit, which way the water points, how tightly things pack, and how far the charge is screened all enter. My task was to find chemically reasonable structures that explain both signs.
First, give Cu some water
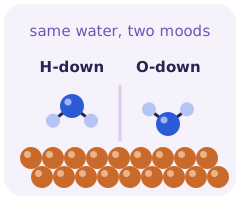
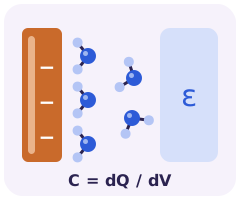
I started with water on Cu(111), with a dielectric continuum beyond it standing in for the rest of the solution. Explicit water lets me tell apart molecules pointing a hydrogen toward the metal (H-down) from those pointing their oxygen toward it (O-down). These are orientation classes, not permanent job titles; molecules switch between them.
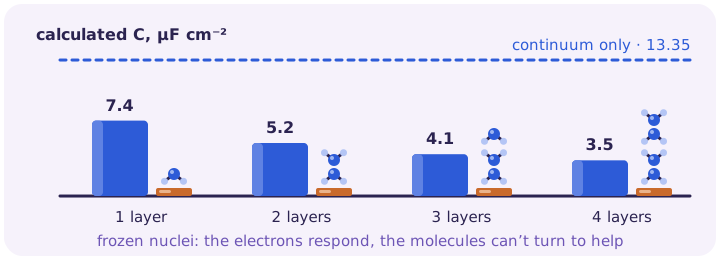
The sampled one-layer structures give 7.3–7.5 µF cm⁻², averaging about 7.4. The three-layer frozen-snapshot average is about 4.2. Continuum solvent alone gives about 13.35. So adding explicit water lowers the calculated capacitance.
That looks backwards if more water should mean more bulk-like screening. The detail that resolves it is what the calculation lets move. Molecular dynamics lets the water explore local arrangements. I then compute the charging response with the nuclei frozen in each sampled geometry. The electrons respond, but the molecules cannot turn to follow the field. A high-dielectric continuum includes exactly the kind of response those frozen nuclei cannot give.
Thickness matters, and the model notices
In the layer series, one to four explicit layers give about 7.4, 5.2, 4.1 and 3.5 µF cm⁻², read from the supporting plot. The three-layer value in that series and the snapshot average above come from different comparisons, so I keep them labelled separately rather than treating them as one number.
The drop from three to four layers is a useful warning. It shows sensitivity to how the explicit region is built, not convergence to a single bulk value. More explicit layers make a thicker frozen region, and that region screens differently from the continuum it replaces.
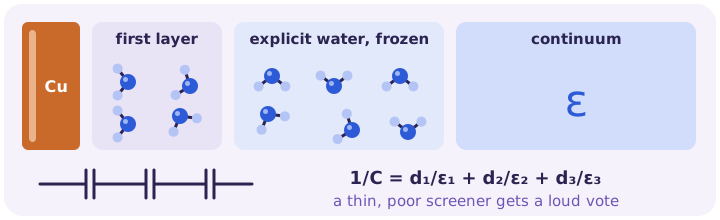
The familiar capacitors-in-series picture helps here. The inverse capacitance adds up a thickness-over-screening term from each region, so a thin region that screens poorly can dominate. Real molecular layers have no obligation to come with sharp edges or a single dielectric constant, so I use the picture to explain the direction of the trend, not to assign each water layer a permittivity.
Acetone changes the neighborhood
With the water reference in hand, I replaced one layer of the three-layer model with acetone, placed next to Cu, in the middle, or near the outer edge. That changes position while keeping everything else about the model the same.
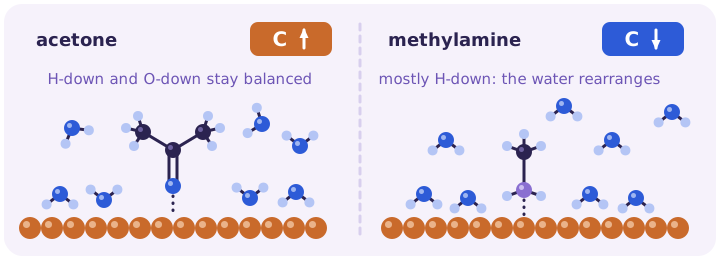
Every placement raises the capacitance relative to pure water. Acetone next to Cu gives the largest increase, the middle placement the next largest. That makes sense: a change close to the stored electrode charge has the most direct effect on screening.
Acetone brings a polar carbonyl and two methyl groups. Its isolated-molecule polarizability is near 7.9 ų, against roughly 1 ų for water. But the carbonyl contact and the space taken by the methyl groups also change the water next to it. Molecular polarizabilities do not add up like items on a grocery receipt.
One-layer mixtures give an independent check. Acetone can approach with its carbonyl roughly vertical or lie flatter on Cu, leaving different room for water. Every arrangement tested still gives higher capacitance and polarizability than its water-only reference. Agreement in sign across different constructions is more convincing than the exact size from any one of them.
The sizes are still instructive. A representative three-layer arrangement raises capacitance by about 21% but polarizability by about 200%. A representative one-layer arrangement gives about 11% and 16%. The two quantities move together without a fixed ratio, because they describe different responses under different boundary conditions.
I also checked what the trajectories were actually doing. Acetone stayed in its assigned region throughout the sampled motion. The bottom, middle and top models therefore describe different local arrangements; they say what each arrangement would do if present, not how often it occurs in the experiment.
Methylamine rearranges it
Methylamine is the more revealing case, because it defeats the isolated-molecule argument outright. It is more polarizable than water, yet the measured capacitance falls as its concentration rises near the minimum.
Its nitrogen has options. The lone pair can bind Cu or accept a hydrogen bond, the N–H groups can donate hydrogen bonds, and a local proton transfer can make a methylammonium–hydroxide pair. Those options let methylamine reshape the water network in ways the acetone arrangements do not.
In the three-layer models, every methylamine configuration tested lowers both capacitance and polarizability relative to water, with the largest drops close to Cu. One-layer calculations keep the same direction, whether the molecule is bound to Cu through nitrogen or held near the surface by its water.
The water orientation gives a structural clue. Around acetone, H-down and O-down populations stay roughly balanced. Methylamine produces a lasting H-down bias, especially in the unbound middle and bottom arrangements. The water is part of the solute effect.
Some methylamine configurations also form local ion pairs. That is chemically relevant, but I would not make one ion pair the sole cause of the whole response. Proton transfer, orientation, packing and Cu–water contacts all change together, and a Cu-bound methylamine uses its lone pair differently from an unbound one. The shared decrease across all these cases is more robust than any single microscopic story.
It helps to separate organizing from responding. The nuclei rearrange first and set up the local electronic environment. The frozen-geometry calculation then measures how the electrons in that environment respond. It does not measure slow water rotation under an applied field. The molecules arrange the room before I test how its electrons react.
A response is not a head count
A capacitance measurement can tell me that the interface changed without telling me which structure it became. Several arrangements can give the same sign. To get their populations I would need thorough sampling, consistent chemical potentials, and free energies for moving molecules between environments.
The trajectory diagnostics keep this honest. Bounded energy fluctuations support local sampling, and layer-averaged heights show that the assigned regions stay recognizable. Neither shows that every relevant solvent-exchange barrier has been crossed. A middle layer whose height overlaps its neighbors is not, by itself, evidence that molecules swap layers freely.
Deep dive: what the experimental capacitance includes
The impedance data were fitted with a resistance and a constant phase element rather than an ideal capacitor. Effective capacitance came from the fitted resistance and the characteristic frequency of the semicircle, normalized by geometric area. That number depends on the equivalent circuit and on real-electrode heterogeneity. I compare it with the frozen-configuration calculations through trends first, without assuming the absolute values are the same observable.
The same care applies to formation energies. Optimizing a structure taken from a final snapshot characterizes an endpoint; it does not turn it into a trajectory-averaged free energy. A more negative formation energy after adding water also partly reflects having more molecules. Neither gives the equilibrium population of water layers.
The direction of each solute effect survives every model choice I tested. The exact microscopic populations and the full frequency-dependent response are still open. That is enough to support a collective, interface-level explanation, and it leaves a clear next task for sampling and experiment.
Before reduction, the interface has changed
What I take from this is that reactants start doing chemistry well before their reduction step. Acetone and methylamine rearrange the contacts around Cu, and that changes the electrical response. The electrolyte is already shaping the surface on which the later reaction will run.
It would be tempting to carry the capacitance trend straight into a prediction of amine yield, and the work does not support that jump. Organic reduction runs at more cathodic potentials in different mixtures. A changed charging response does not imply a changed imine-hydrogenation barrier, and higher capacitance is not automatically better catalysis.
Methylamine does leave a useful lead. Its nitrogen talks to water and to Cu. In Part 2, I follow that same coordination chemistry into a less comfortable question: what happens when the amine helps a Cu atom leave?
Where this was published
Probing the Electric Double-Layer Capacitance to Understand the Reaction Environment in Conditions of Electrochemical Amination of Acetone, ACS Applied Materials & Interfaces 17, 4087–4097 (2025). This post follows thesis Chapter 3. I did the calculations and computational analysis; the measurements are reported in the same paper.