For my internship I left my UCLA computational chemistry desk for a while and joined SES AI, a battery company, as an Applied Scientist intern. The problem was that today's AI is very good with pictures and text, while chemistry and batteries live in 3D geometry, in physical time, and in scales that connect, where a tiny change in one molecule shows up much later as a battery that lasts longer (or doesn't). So the work ended up as a grid rather than a straight line: three scales stacked on top of each other, each known through several kinds of data, with the same small method run at every level.
The picture in one diagram
The official title I gave the work was “multiscale multimodal intelligence across molecules, electrolytes, and cells,” which is a mouthful, so here it is as one picture instead.
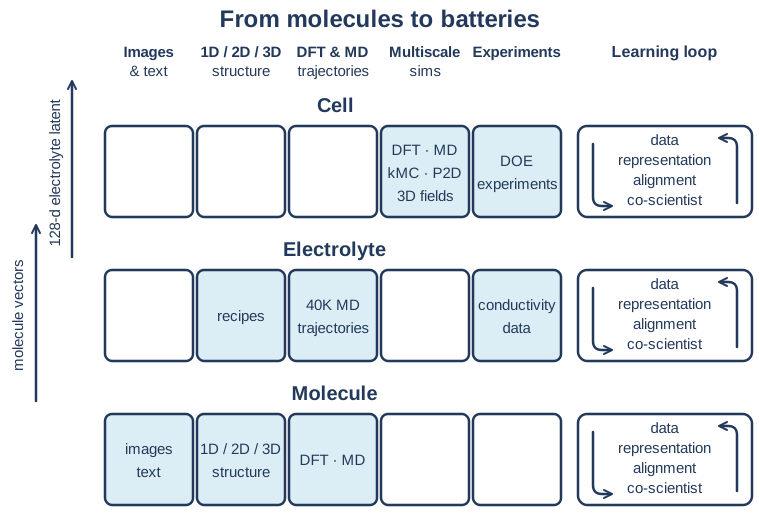
Read it in three directions. Up the rows is the scale axis: what the thing is. Across the columns is the modality axis: how we get to know it. And the loop on the right of every row is the method, the same four steps each time. The short sections below take one direction at a time.
The scale axis: molecule, electrolyte, cell
Each row is a layer, and each layer is made of the one below it: molecules make up electrolytes, and electrolytes go into cells.
Think of a battery like a city. The molecules are the people. The electrolyte is the crowd, the liquid the ions swim through, made of salt, solvents and additives. The cell is the whole city, with its traffic jams, heat waves and aging infrastructure. You can’t understand a city from one person’s ID card, and you can’t understand a crowd without watching it move, so the work split into three parts, one per layer, each building on the last.
The modality axis: many ways to know each layer
At every layer, no single kind of data tells the whole story, and the layers don’t even share the same kinds. Here is what each row of the diagram actually holds.
 Molecule
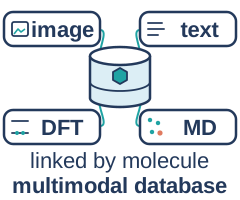
- Images and text: molecule drawings in real papers (hand-drawn ones too) and what the paper says about them
- 1D/2D/3D structure: SMILES and fingerprints, atom graphs, 3D conformers
- DFT and MD properties: energies, HOMO/LUMO, how readily it gets reduced; solvation, density, diffusion, transport
 Electrolyte
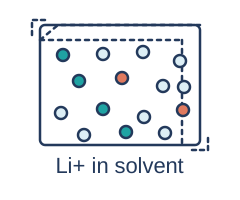
- Recipes: components, amounts and conditions like temperature
- DFT clusters: the ion with one partner, or a solvent and an anion competing for it
- MD trajectories: about 40,000 of them, 5,000 frames each, roughly 200 million frames
- Conductivity data, including the public CALiSol dataset
 Cell
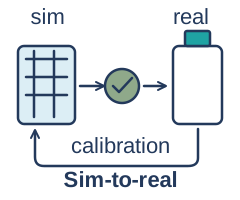
- Multiscale simulations: DFT, MD, interface reactions, kMC, P2D/SPMe and 3D temperature and stress fields
- Experiments: a 252-formulation, additive-centered DOE
- Design and test conditions: protocol, temperature, C-rate
None of this is text in the way a chatbot would like. That was the question I kept asking all internship: can AI understand not just pictures and text, but 3D geometry, physical time, and how the scales connect?
The same loop at every layer
Only when I laid the three parts side by side did I notice that every layer runs the same loop: gather the data, learn a representation, align the different views of the same thing, then hand it to a co-scientist that helps decide what to do next. Prediction sits on top of the aligned space at every layer.
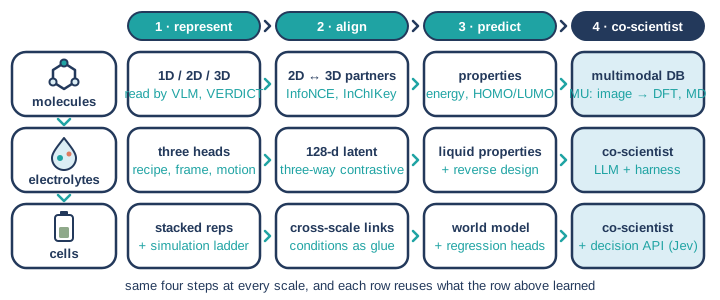
| Data | Representation | Alignment | Co-scientist / decision | |
|---|---|---|---|---|
| Molecule | paper figures read by VLMs, checked by VERDICT | 1D/2D/3D vectors | 2D ↔ 3D partners (InfoNCE), keyed by InChIKey | multimodal database in MU and a Chrome extension |
| Electrolyte | polarizable force field, ~40,000 MD movies | recipe, snapshot and trajectory heads | three-way contrastive, one 128-d latent | electrolyte co-scientist |
| Cell | 252-formulation DOE plus a simulation ladder | stacked molecule, electrolyte and cell reps | cross-scale links, conditions as the glue | aging world model, cell co-scientist, decision API |
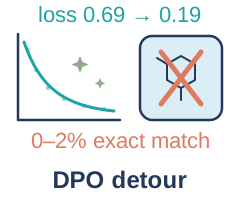
One lesson also kept showing up at every layer: a pretty number on the training objective is not the same as the scientific goal. A preference model can score beautifully and still get molecules wrong. A force field can nail tiny clusters and still ruin the liquid. An alignment can match molecules perfectly and still say almost nothing about real batteries. So most of my summer went into the checks: agreement between independent readers, liquid simulations inside the fitting loop, calibration against real measurements.
How representations flow upward
The layers aren’t three separate projects, because what one layer learns becomes input to the next. Nothing from the lower rows gets thrown away.
Molecule vectors become ingredients
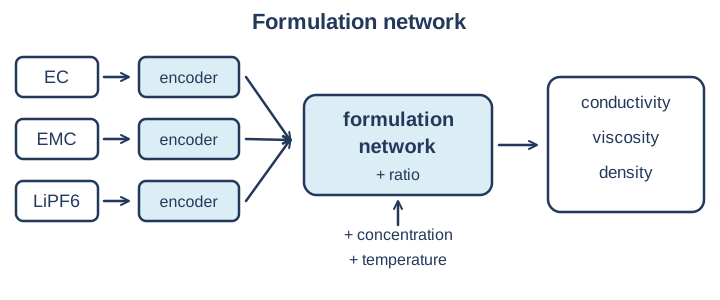
Part 1 turns every recognized molecule into vectors. In the electrolyte layer those vectors become ingredients on the recipe side: a formulation network takes one vector per molecule, plus mixing ratios, salt concentration and temperature, and predicts how the mixture behaves.
The electrolyte latent and molecules build the cell
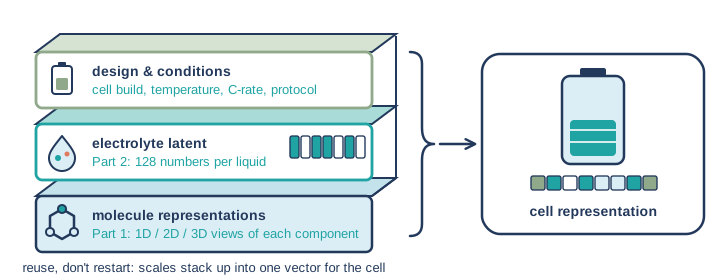
Part 2 turns every electrolyte into 128 numbers in a shared latent space, learned from recipes, snapshots and trajectories. In Part 3 a cell is represented by stacking those pieces: the molecule representations for each component, the electrolyte latent for the mixture, and the cell’s own design and operating conditions on top. The cell co-scientist reads the same stack, with 396 molecular, 274 electrolyte and 105 cell features per record in its early version.
The three parts
Each part walks through one row of the diagram in detail, in the order the stuff itself is built.
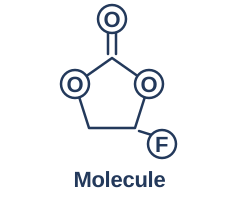 Part 1: molecules
Atom is atom, bond is bond. Reading molecules off real paper figures (59.8% exact on 331 journal figures), VERDICT’s four readers that may abstain, a rotation-aware recognizer, and 1D/2D/3D vectors in a multimodal database.
 Part 2: electrolytes
Teaching a puddle to dance. A polarizable force field for 627+ molecules and 20+ anions, PFF RSI learning from more than 50 failed versions out of 80, three heads over about 40,000 MD movies, and an electrolyte co-scientist.
 Part 3: cells
From molecules to batteries. A six-rung simulation ladder around a 252-formulation DOE, scales held together by test conditions, an aging world model that learns the whole evolution step by step, and a cell co-scientist.
What this got us
I started from batteries and ended up with a method. Batteries were just where I happened to begin; the method should transfer to similar multiscale systems, the ones built as molecules, then mixtures, then devices, where the important structure lives in drawings, geometry and simulations rather than text, and where experiments are scarce but simulation is possible. It’s still a living method, and I keep adding pieces as the field moves. Grab a snack: Part 1 starts at the bottom row, with a molecule and a computer trying to figure out who it is.